
Step-by-step setup · Updated November 2, 2026
Set up GreetFeedback and understand your NPS results
Publish a free private-feedback survey, share its link or QR code, and understand the score, comments and follow-up workflow. Real survey and empty-report screenshots show what customers and owners see.
Explore GreetFeedback features and screenshots or create a free GreetMode account.
1. Prepare your survey and preview the experience
Create a free account or sign in, choose the right website under Your sites, and select GreetFeedback in Manage products. No paid plan or credit card is required. In Settings, open Survey setup and publishing to add your business name, introduction, optional follow-up question, thank-you message and accent color.
The survey asks how likely a customer is to recommend your business on a 0–10 scale. The written explanation is optional. Customers do not need to enter a name or email, so avoid asking for sensitive information in the comment. Every score receives the same thank-you message.
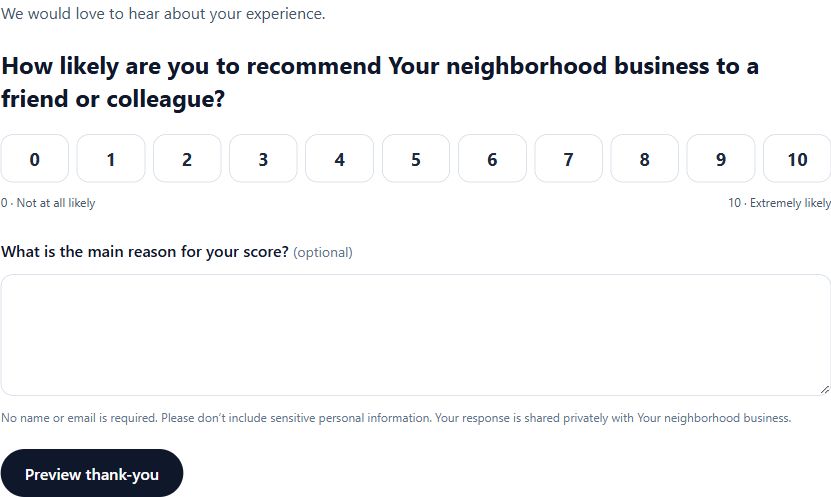
Open Preview survey and thank-you in Settings, or try the public sample on the product page. Check score selection, the optional question and confirmation text. A preview is separate from a real published response.
Try the actual sample survey →2. Publish and test before sharing
Select Publish and accept responses, then Save survey. Copy the survey link or download the QR PNG under Share your survey. The hosted page and QR work after publication; you do not need to install a JavaScript snippet to share them. To pause collection, clear the publish option and save.
Open your published link on desktop and phone, and scan the actual printed QR. Submit a clearly marked test response and confirm it appears in your own dashboard. A live test response counts in reporting; the browser-only sample preview does not. Do not treat a test response as customer sentiment.
Share consistently using your existing communication channels. GreetFeedback does not send automatic survey invitations or route only high scorers to Google reviews. Keep private feedback and public review requests separate.
Set up an honest Google review-request page →3. Read the score with the response count
In Settings, choose a reporting period of 7, 30, 90 or 365 days. The NPS summary and weekly trend use all responses in the selected UTC period. With no responses, the score is blank rather than zero.
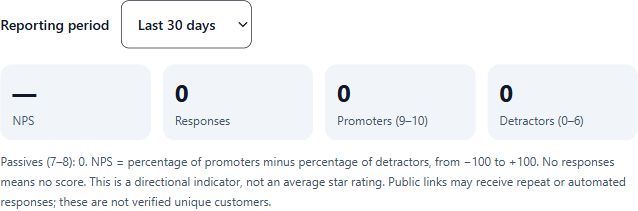
Promoters score 9–10, passives 7–8, and detractors 0–6. NPS is the percentage of promoters minus the percentage of detractors, with passives included in the response total. The range is −100 to +100; this is not an average star rating.
Worked example, not customer data: among 10 responses, 6 promoters, 2 passives and 2 detractors produce 60% minus 20%, or NPS +40. Small samples can move sharply. Read the comments and response count alongside changes in the score; repeat or automated submissions are not verified unique customers.
Bain’s explanation of the NPS calculation →4. Review comments and track internal follow-up
The Results tab gives a quick snapshot. Open Settings for detailed reporting, weekly trends and the response list. Filter by rating group and follow-up status to find responses needing attention. These filters affect the list and response CSV, not the all-response NPS summary or trend for the selected period.
Mark responses New, Reviewed or Resolved as your team investigates themes and makes improvements. Changing follow-up status does not change the score. Because the survey does not require contact details, a status change is internal tracking, not an email reply or a promise that you can identify the customer.
Export the NPS summary for totals and weekly trends, or export responses when you need the individual comments. Keep those files private. Use feedback to improve the experience rather than deciding which customers may leave a Google review.
Explore GreetFeedback features and screenshots →