
100 Small Business Website & Customer Experience Statistics November 2026
Your website can look polished and still leave a visitor unsure what to do next. The useful questions are practical: can someone get an answer, judge whether to trust the business, understand a data choice and complete the task they came for?
This reference brings together original research on customer conversations, reviews, privacy, bot activity, accessibility and technology choices. Some findings concern small businesses directly; others describe broader consumer populations or provider-observed network traffic. Those differences are kept visible.
Updated November 2026. Sources checked November 4, 2026. These findings provide context for website decisions; they are not measured GreetMode customer results or promised improvements.
Key Takeaways
- In Sogolytics’ June 2026 U.S. survey, 69% rated their most recent customer experience positively. (Sogolytics, October 2026)
- 35% cited long waits or delayed service as a reason for poor experiences in Sogolytics’ June 2026 U.S. survey. (Sogolytics, October 2026)
- 97% read local-business reviews in BrightLocal’s U.S. consumer survey. (BrightLocal, February 2026)
- 89% expect a business response to reviews in BrightLocal’s 2026 U.S. local-review survey. (BrightLocal, February 2026)
- 64% wanted tailored experiences in Qualtrics’ global research released in October 2025. (Qualtrics, October 2025)
- 67% wanted more transparency about personal-data use in the June 2026 U.S. customer survey. (Sogolytics, October 2026)
- 53% of observed traffic was automated in Imperva/Thales’ 2025 network view. (Imperva / Thales, April 2026)
- Cloudflare measured other AI bots at 4.2% of HTML requests in its 2025 observation window, with Googlebot counted separately. (Cloudflare, December 2025)
- 95.9% of sampled homepages had automatically detected accessibility failures in WebAIM’s February 2026 analysis. (WebAIM, November 2026)
- WHO’s March 2023 fact sheet estimated 16% of the global population experiences significant disability. (World Health Organization, March 2023)
- 41% used six or more technology platforms in the Chamber/Teneo July–August 2026 U.S. small-business survey. (U.S. Chamber of Commerce / Teneo Research, October 2026)
- 84% planned to increase technology use over the next two to three years in the Chamber/Teneo July–August 2026 U.S. small-business survey. (U.S. Chamber of Commerce / Teneo Research, October 2026)
What makes customer conversations worth improving?
A contact channel earns its place when it helps a customer get a useful answer. The studies below distinguish experience quality, feedback follow-through and purchase priorities; none measures the effect of installing GreetMode.

Which service problems do customers notice?
Customers identify both speed and the quality of the response as parts of their experience. Sogolytics asks about experiences across industries and channels, so its findings are broader than website chat. Treat the results as a way to design questions for your own business: can a visitor reach someone, understand the next step and get an issue resolved? Fast acknowledgement is useful, but a greeting alone does not resolve an unclear price or an unanswered question. Give the person handling messages enough context to help, and make the route to a human clear when the first response is insufficient.
Scope: U.S. customers, Q2 2026; reasons allow multiple responses.
| Measure | Result | Primary source |
|---|---|---|
| Satisfied with overall brand experience | 63% | (Sogolytics, October 2026) |
| Fast response/resolution cited for great experiences | 31% | (Sogolytics, October 2026) |
| Poor communication/unhelpful responses cited | 31% | (Sogolytics, October 2026) |
| Lack of empathy cited | 26% | (Sogolytics, October 2026) |
| Unresolved issues/lack of accountability cited | 26% | (Sogolytics, October 2026) |
| Hidden fees/misleading information cited | 22% | (Sogolytics, October 2026) |
Does hearing feedback mean the relationship is secure?
Visible improvements and continued loyalty are separate measures. A customer can recognize that a business listened and still consider leaving after the next disappointing interaction. The feedback-improvement item below concerns people who supplied feedback, while the loyalty and trust items describe broader customer responses. Keep those bases separate when comparing results. For a small team, the practical task is to connect a comment with an owner, a follow-up and a recorded outcome. GreetFeedback and the live-chat staffing guide provide relevant starting points for organizing that work.
Scope: U.S. customers, Q2 2026; improvement item is among those providing feedback.
| Measure | Result | Primary source |
|---|---|---|
| Feedback providers reporting clear, visible improvements | 42% | (Sogolytics, October 2026) |
| Customers identifying as somewhat loyal | 32% | (Sogolytics, October 2026) |
| Likely to switch after a single bad experience | 33% | (Sogolytics, October 2026) |
| Honest/open communication cited as a trust driver | 38% | (Sogolytics, October 2026) |
| Respectful treatment cited as a trust driver | 35% | (Sogolytics, October 2026) |
| Fair/transparent pricing cited as a trust driver | 30% | (Sogolytics, October 2026) |
Is price the only reason a customer chooses a business?
Qualtrics’ consumer research includes value, quality and convenience as reasons for doing business. These are overlapping reasons, not competing market shares or a ranking of website features. A business can make its site clearer without turning the experience into a price-only comparison: explain what is included, when someone will respond and what happens after an enquiry. The spending finding records consequences following poor experiences; it does not establish that a particular tool prevents lost revenue. Keep the research separate from claims about your own results, then use your enquiries and feedback to identify where visitors still need help.
Scope: Global consumer research, 2026 edition released October 2025; reasons not mutually exclusive.
| Measure | Result | Primary source |
|---|---|---|
| Good value cited as a reason for doing business | 46% | (Qualtrics, October 2025) |
| Good product/service quality cited | 42% | (Qualtrics, October 2025) |
| Convenience cited | 41% | (Qualtrics, October 2025) |
| Bad experiences followed by reduced spending | 1 in 2 | (Qualtrics, October 2025) |
How do reviews and business responses shape decisions?
Reviews are part of the customer journey, not a substitute for a clear website. Local-business research and e-commerce research offer complementary views, but their respondents and purchase contexts should remain distinct.
What makes a local-business review useful?
BrightLocal’s respondents consider recency, volume, rating and consistency when judging local reviews. The time windows and rating thresholds below are the survey’s specific cutoffs, not universal rules every customer follows. Several qualities can matter to the same person, so percentages from the different questions should not be added together. Make it easy for customers with real experiences to leave honest feedback, and keep the next step visible for a reader who wants to enquire. A review profile can support a decision while still leaving questions about availability, fit and service scope for the business to answer directly.
Scope: U.S. adults, BrightLocal 2026 local-business review survey.
| Measure | Result | Primary source |
|---|---|---|
| Always read reviews when browsing for businesses | 41% | (BrightLocal, February 2026) |
| Average review sites used when choosing businesses | 6 | (BrightLocal, February 2026) |
| Will not use a business with fewer than 20 reviews | 47% | (BrightLocal, February 2026) |
| Only care about reviews from the last three months | 74% | (BrightLocal, February 2026) |
| Require a rating of at least 4.5 stars | 31% | (BrightLocal, February 2026) |
| Value matching sentiment across reviews | 56% | (BrightLocal, February 2026) |
| Value a written positive experience | 46% | (BrightLocal, February 2026) |
| Value a review posted within the last month | 44% | (BrightLocal, February 2026) |
| Value a high star rating | 42% | (BrightLocal, February 2026) |
| Value an owner response | 37% | (BrightLocal, February 2026) |
What do customers expect after they post a review?
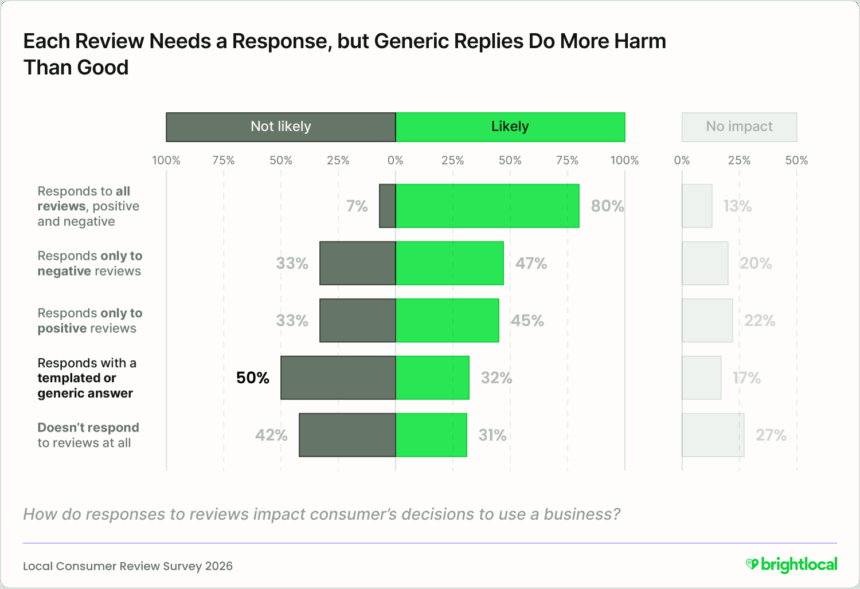
The survey separates whether a business replies from how it replies. A tailored acknowledgement can address the actual experience without exposing personal details or promising an outcome the business cannot deliver. These are stated preferences, so a higher likelihood response should not be presented as measured sales growth. The same-day figure is a specific expectation category, not a recommended response-time guarantee. GreetReviews offers a relevant path for honest review requests; any response process still needs someone to read the feedback, decide what can be said publicly and follow through on unresolved issues.
Scope: U.S. adults, BrightLocal 2026; stated choices and response expectations.
| Measure | Result | Primary source |
|---|---|---|
| Likely to use a business responding to all reviews | 80% | (BrightLocal, February 2026) |
| Unlikely to use a business never responding | 42% | (BrightLocal, February 2026) |
| Expect a same-day review response | 19% | (BrightLocal, February 2026) |
| Unlikely to choose a business using generic replies | 50% | (BrightLocal, February 2026) |
Do first-time online purchases follow the same pattern?
Clutch’s separate e-commerce survey shows how respondents use reviews while evaluating an unfamiliar purchase. Its results support the importance of context beyond an average star score, but they should not be pooled with the local-business survey into a single consumer percentage. Looking at reviews during comparison and again before purchase can describe the same person at different stages. On a business website, provide enough detail to answer the questions reviews cannot settle: what is offered, who it suits and how to contact the team. Published testimonials should remain attributable to authentic experiences rather than manufactured endorsements.
Scope: Separate U.S. consumer e-commerce survey, 2026 report.
| Measure | Result | Primary source |
|---|---|---|
| Regularly check reviews for first-time purchases | 96% | (Clutch, February 2026) |
| Read reviews while comparing options | 72% | (Clutch, February 2026) |
| Read reviews before finalizing a purchase | 69% | (Clutch, February 2026) |
| Trust star ratings on their own | 15% | (Clutch, February 2026) |
How do privacy choices affect customer trust?
Personalization works within a relationship of trust. Consumer attitudes and organizations’ own reports measure different sides of that relationship; neither establishes whether a cookie banner or data practice meets a legal requirement.

What information uses are consumers comfortable with?
Consumer interest in a tailored experience does not mean comfort with every method used to create it. Qualtrics distinguishes several personalization practices, while Sogolytics asks a separate U.S. sample about transparency and selling data without consent. The studies differ in geography, timing and wording. Their findings should not be treated as direct measures of willingness to accept a particular website banner. A useful design question is whether a visitor can understand the choice in front of them. Keep optional data uses explainable, and let the interface reflect the actual behavior of the site rather than relying on a broad claim of trust.
Scope: Global consumer survey, 2026 edition released October 2025; U.S. customers, June 2026; agreement with survey statements.
| Measure | Result | Primary source |
|---|---|---|
| Believe personalization benefits justify privacy costs | 41% | (Qualtrics, October 2025) |
| Believe organizations handle personal information responsibly | 39% | (Qualtrics, October 2025) |
| Comfortable with learning habits/remembered website behavior | 30% | (Qualtrics, October 2025) |
| Comfortable with predictive ordering | 27% | (Qualtrics, October 2025) |
| Comfortable with device listening/watching | 16% | (Qualtrics, October 2025) |
| Would stop buying if data were sold without consent | 66% | (Sogolytics, October 2026) |
How do organizations report making data use clearer?
Cisco’s organizational study reports practices described by professionals with privacy responsibilities. These are accounts of what organizations do and how they judge their efforts, rather than an independent test of customer satisfaction. Interactive controls and contractual explanations also serve different audiences and purposes. For a small-business website, start with an accurate inventory of what runs on the page and what happens after a visitor submits information. GreetConsent is relevant to presenting cookie choices, while the surrounding explanation needs to match the business’s real setup. The survey does not establish a compliance result for GreetMode or any customer site.
Scope: Privacy-responsible professionals, September 2025; organizational reports.
| Measure | Result | Primary source |
|---|---|---|
| Organizations reporting rising transparency demand over three years | 85% | (Cisco, January 2026) |
| Offer interactive data-view/control dashboards | 55% | (Cisco, January 2026) |
| Embed transparency in contracts | 50% | (Cisco, January 2026) |
| Report effective customer transparency efforts | 97% | (Cisco, January 2026) |
| Agree privacy laws improve customer comfort with AI | 87% | (Cisco, January 2026) |
Which trust-building action did organizations rank first?
This Cisco question asks organizations to select an action they regard as most effective. It is not a controlled experiment comparing alternative banners, and it does not ask consumers to rank their preferences directly. A lower share selecting an action does not make that action optional or unimportant. Use the table to understand the distinction between explaining a practice, giving someone a control and protecting the underlying information. A website can need all of these at once. Avoid turning this ranking into a claim that clear wording replaces security, privacy obligations or the ability to honor a visitor’s choices.
Scope: Organizational respondents choosing their most effective trust action, September 2025.
| Measure | Result | Primary source |
|---|---|---|
| Select clear data-use information as the top trust action | 46% | (Cisco, January 2026) |
| Select demonstrating privacy-law compliance | 18% | (Cisco, January 2026) |
| Select not selling data for advertising/marketing | 16% | (Cisco, January 2026) |
| Select avoiding data breaches | 14% | (Cisco, January 2026) |
| Select configurable privacy settings | 6% | (Cisco, January 2026) |
How much website activity comes from bots?
A request is not automatically a customer visit. Network telemetry helps explain automation, but its classifications and denominators must travel with the number, especially when comparing different providers.

What do traffic and attack shares measure?
Imperva/Thales distinguishes automated traffic from human traffic, then reports separate attack measures. The API and financial-services findings describe where observed attacks were directed, not the probability that a small business will be attacked. Account takeover also has its own incident base. Keep those categories apart when explaining risk to a business owner. A busy endpoint, a form submission and a page view can each represent different activity. The useful question is what an interaction is trying to do and whether it aligns with the site’s purpose. The report provides network context, not a diagnosis of GreetMode customer traffic.
Scope: Imperva/Thales observed 2025 global traffic and attacks; denominators differ.
| Measure | Result | Primary source |
|---|---|---|
| Human share of observed traffic | 47% | (Imperva / Thales, April 2026) |
| Bot attacks targeting API endpoints | 27% | (Imperva / Thales, April 2026) |
| Bot attacks targeting financial services | 24% | (Imperva / Thales, April 2026) |
| Account-takeover attacks targeting financial services | 46% | (Imperva / Thales, April 2026) |
Why separate AI crawlers from other traffic?
Cloudflare’s selected analysis looks only at requests for HTML content and separates Googlebot from other AI bots because it serves more than one crawling purpose. That is a different denominator from all-content request traffic, and a different network view from Imperva’s. Do not average the two providers’ percentages into a single internet-wide figure. Crawling can be useful for discovery and indexing, so automation alone is not evidence of malicious intent. When interpreting analytics, distinguish crawler requests from visits that can realistically make an enquiry, and retain the observation window before comparing a historical baseline with current activity.
Scope: Cloudflare HTML requests, January 1–December 2, 2025; Googlebot excluded from other-AI category.
| Measure | Result | Primary source |
|---|---|---|
| Googlebot: HTML-request share, counted separately | 4.5% | (Cloudflare, December 2025) |
Does a bot’s network address identify its intent?
An origin country or network identifies where a request’s IP address is associated, not who controls the request or whether it is harmful. Cloud platforms can host useful and unwanted automation. Blocking a location solely because it appears in a network-wide table can therefore interfere with legitimate services and still miss harmful behavior elsewhere. GreetProof’s product page describes the planned bot-prevention tool; its coming-soon status should remain clear. These observations explain the measurement problem and do not demonstrate that the product has detected or prevented any particular share of traffic.
Scope: Cloudflare all-content observed bot requests, January 1–December 2, 2025.
| Measure | Result | Primary source |
|---|---|---|
| Bot requests originating from U.S. IP addresses | 40% | (Cloudflare, December 2025) |
| Bot requests originating from German IP addresses | 6.5% | (Cloudflare, December 2025) |
| Bot requests from the ten leading origin countries | 71% | (Cloudflare, December 2025) |
| Bot requests from two AWS-associated networks, combined | 14.4% | (Cloudflare, December 2025) |
| Bot requests from two Google Cloud-associated networks, combined | 9.7% | (Cloudflare, December 2025) |
What can accessibility testing reveal about a website?
Accessibility starts with whether people can use the page. Automated homepage analysis helps find recurring barriers, while population research provides context for inclusion; neither describes the experience of every visitor to a small-business site.
How widespread are automatically detected homepage barriers?
WebAIM tests influential homepages rather than every page of every website. Its automated results identify many likely barriers, but passing an automated check does not establish complete accessibility. The low-error groups below overlap, and an error count is not a count of people unable to use a page. WHO’s global disability estimate provides population context, not a calculated share of website traffic or lost sales. A practical review combines automated checks with keyboard navigation and attention to the tasks visitors need to complete. Keep the date and sample visible when using a broad study to explain why that work matters.
Scope: WebAIM February 2026 automated analysis of one million influential homepages.
| Measure | Result | Primary source |
|---|---|---|
| Average detected errors per homepage | 56.1 | (WebAIM, November 2026) |
| Homepages with at most five detected errors | 20.5% | (WebAIM, November 2026) |
| Homepages with at most ten detected errors | 30.4% | (WebAIM, November 2026) |
Which recurring issues are detected most often?
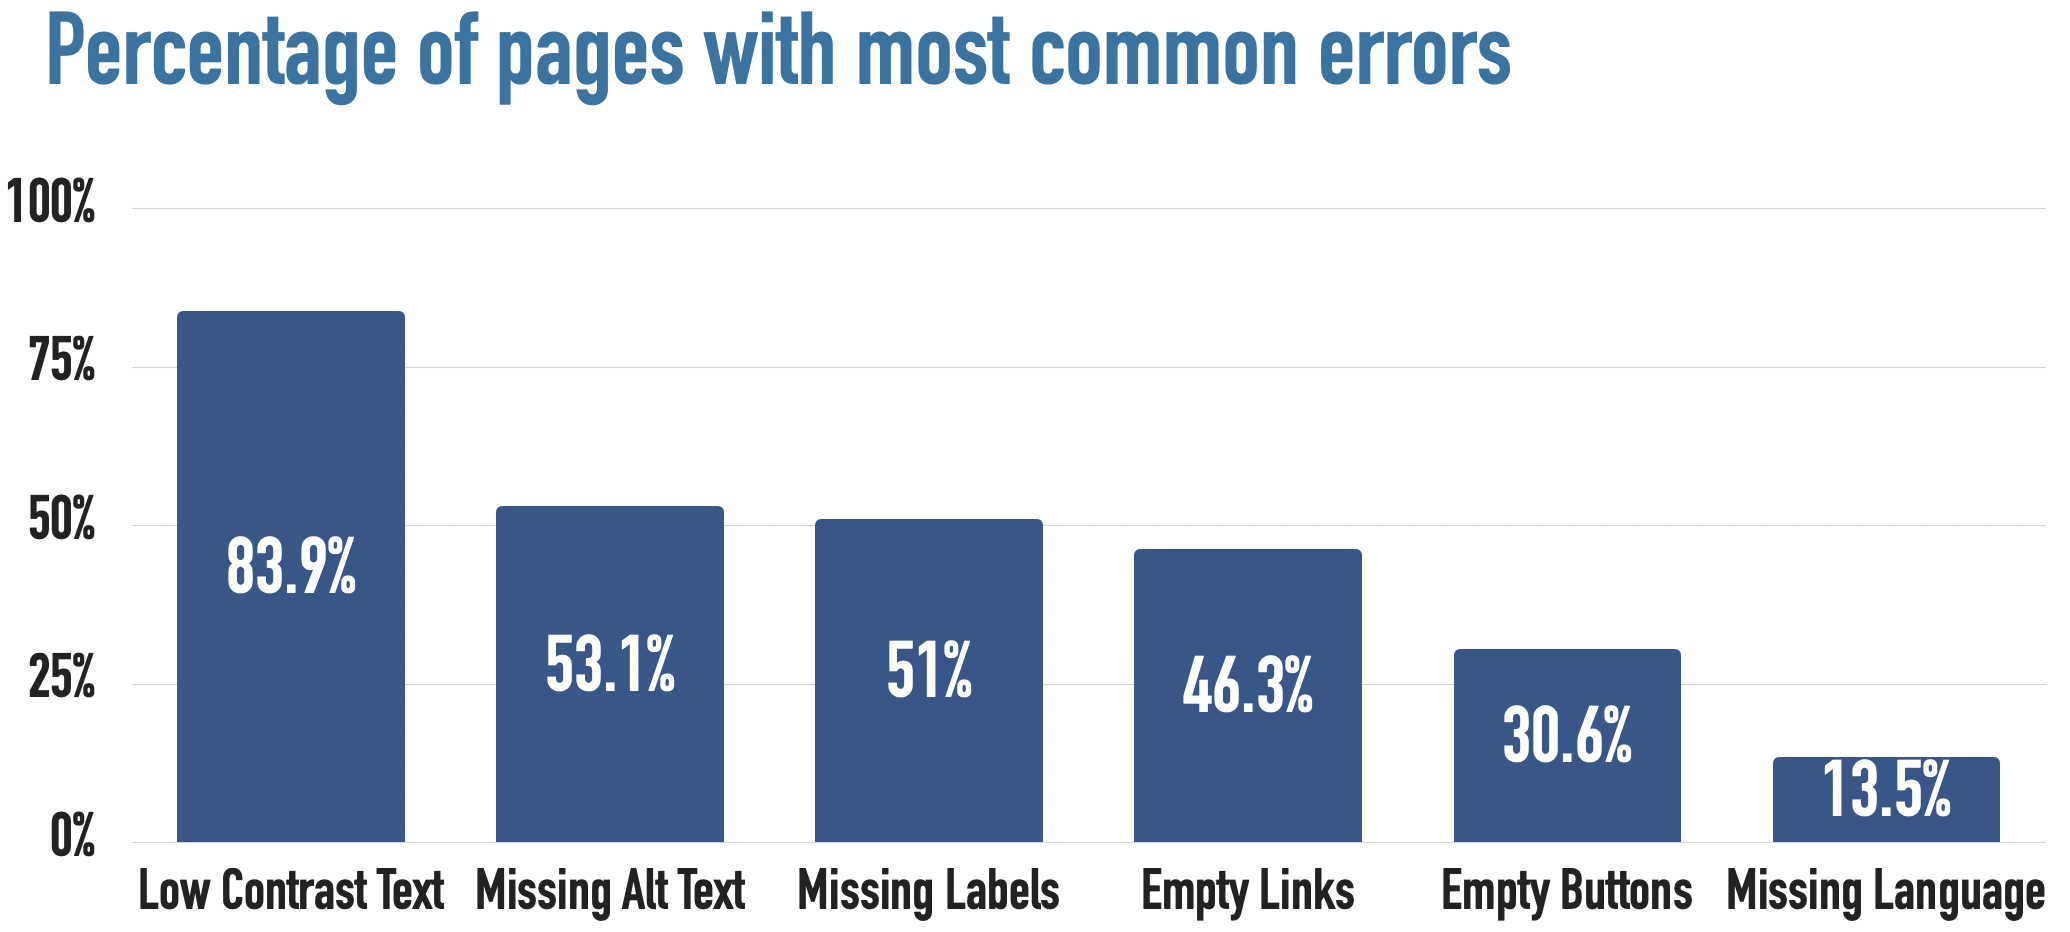
The error-type table counts homepages with each issue, so a page with several problems can appear in several rows. It does not allocate each homepage to a single category. The categories point to concrete checks: readable text, descriptive images, identifiable controls, meaningful links and a declared language. Fixes belong in the content and structure of the site as well as its styling. A settings widget can offer visitor controls, but its presence does not demonstrate that the underlying page is accessible. GreetAccessibility is described as a coming-soon tool and should be evaluated with that status in mind.
Scope: Percentage of sampled homepages, February 2026; overlapping issue types.
| Measure | Result | Primary source |
|---|---|---|
| Homepages with low-contrast text | 83.9% | (WebAIM, November 2026) |
| Homepages missing image alternative text | 53.1% | (WebAIM, November 2026) |
| Homepages missing form-input labels | 51% | (WebAIM, November 2026) |
| Homepages with empty links | 46.3% | (WebAIM, November 2026) |
| Homepages with empty buttons | 30.6% | (WebAIM, November 2026) |
| Homepages missing document language | 13.5% | (WebAIM, November 2026) |
Why do element counts and page counts differ?
An image percentage uses images as its denominator; a form-input percentage uses inputs. Those measures cannot be compared directly with the share of homepages having a problem. A page may have many correctly implemented elements and still contain a control that blocks an essential task. Headings provide structure, while labels explain the purpose of an input and alternative text communicates relevant image content. Review the real customer path, including the contact form and any consent controls, after fixing automated findings. The goal is a usable interaction, and a declining average error count alone does not prove that a particular journey works.
Scope: February 2026; image/input percentages use elements, not homepage denominators.
| Measure | Result | Primary source |
|---|---|---|
| Average low-contrast instances per homepage | 34 | (WebAIM, November 2026) |
| Images lacking alternative text | 16.2% | (WebAIM, November 2026) |
| Form inputs lacking proper labels | 33.1% | (WebAIM, November 2026) |
| Homepages with skipped heading levels | 41.8% | (WebAIM, November 2026) |
| Homepages with no headings | 7.5% | (WebAIM, November 2026) |
How do small businesses choose and manage technology?
A growing toolkit needs a purpose for each tool. The current U.S. adoption study and the older global software-selection survey answer different questions, so their dates and business-size definitions remain separate.
How many platforms do U.S. small businesses use?
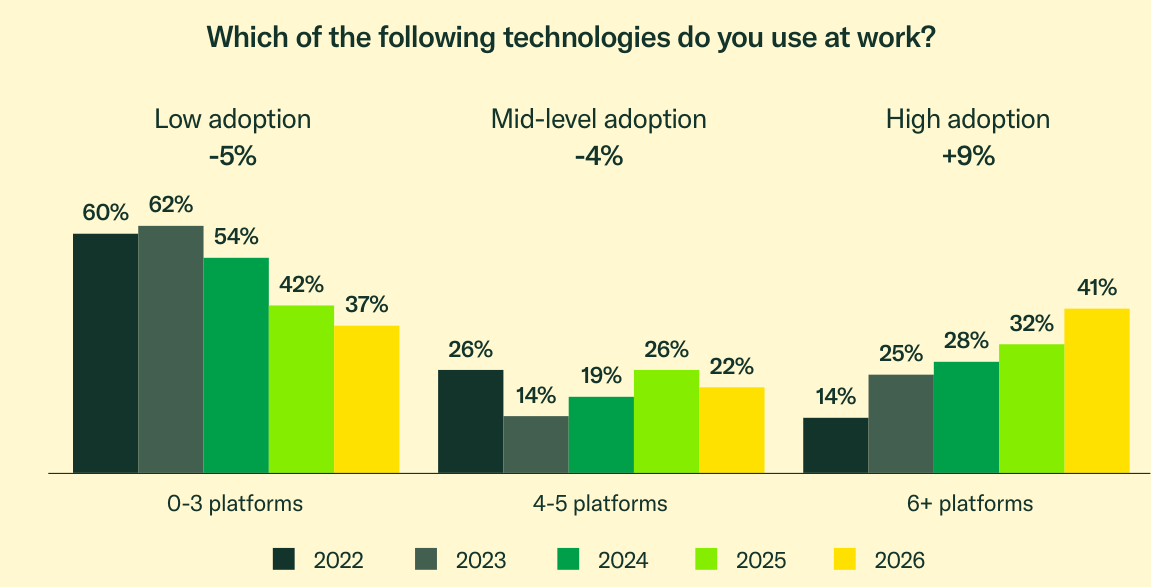
The Chamber/Teneo study measures technology platforms used at work, which can include free services and bundled capabilities. Platform counts should not be interpreted as the number of paid subscriptions or as a recommended stack size. The count groups describe reported use, while plans to expand technology use describe intentions. The AI measure is also a survey response, not an independent audit of a business’s deployment. Use the results to frame a review of your own setup: identify the task, the person responsible and where information moves next before deciding whether another tool will make the work clearer.
Scope: U.S. small businesses with fewer than 250 employees, July–August 2026.
| Measure | Result | Primary source |
|---|---|---|
| Use at least one technology platform | 99% | (U.S. Chamber of Commerce / Teneo Research, October 2026) |
| Use at most three platforms | 37% | (U.S. Chamber of Commerce / Teneo Research, October 2026) |
| Use four or five platforms | 22% | (U.S. Chamber of Commerce / Teneo Research, October 2026) |
| Report using AI | 66% | (U.S. Chamber of Commerce / Teneo Research, October 2026) |
What do AI-using businesses say about access and training?
These questions use the AI-user subgroup, not every surveyed small business. Respondents describe expected consequences of restricted access and their own training activity, rather than measured effects of a particular software purchase. A training plan and a productivity result are different things. Before adding automation to a customer-facing workflow, identify what someone needs to know to operate it, review its outputs and handle an exception. Keep a direct route for customer questions when an automated step is insufficient. Reported enthusiasm for technology does not establish that an untested integration will improve an individual business’s customer experience.
Scope: AI-user subgroup, U.S. small-business survey, July–August 2026.
| Measure | Result | Primary source |
|---|---|---|
| AI users expecting slower growth if access is limited | 78% | (U.S. Chamber of Commerce / Teneo Research, October 2026) |
| AI users expecting bottom-line harm if access is limited | 75% | (U.S. Chamber of Commerce / Teneo Research, October 2026) |
| AI-using businesses working to upskill staff | 95% | (U.S. Chamber of Commerce / Teneo Research, October 2026) |
| AI-using businesses providing on-the-job training | 47% | (U.S. Chamber of Commerce / Teneo Research, October 2026) |
Which software-selection preferences have a historical baseline?
Salesforce’s older survey supplies a clearly labeled baseline for how SMB leaders evaluated new technology. The figures below show only the most emphatic response category, not the combined share rating a factor important. Its business-size definition and global sample differ from the newer U.S. Chamber study. Stable questions about setup, maintenance, compatibility and price remain useful when reviewing a toolkit, but the responses should not be relabeled as current market adoption. GreetMode’s toolkit overview can help identify relevant functions; compare them with the actual workflow and confirm which tools are available before making an implementation plan.
Scope: Historical global SMB survey, August–September 2024; extremely-important category only.
| Measure | Result | Primary source |
|---|---|---|
| Ease of use rated extremely important | 35% | (Salesforce, December 2024) |
| Price rated extremely important | 34% | (Salesforce, December 2024) |
| Compatibility rated extremely important | 33% | (Salesforce, December 2024) |
| Vendor security/reliability reputation rated extremely important | 32% | (Salesforce, December 2024) |
| Ease of setup rated extremely important | 31% | (Salesforce, December 2024) |
| Simple maintenance rated extremely important | 31% | (Salesforce, December 2024) |
Methodology and Sources
The article contains 100 distinct, individually cited observations: twelve in Key Takeaways and the remainder in the tables. Original researchers and data producers are credited directly. Related reports from the same producer are grouped for source-diversity checks; the largest producer contribution is sixteen observations. Source figures can contain extra contextual labels, which are not counted as additional article statistics.
Citation dates identify publication or release month, except WebAIM’s undated live report, where November 2026 is the access month and February 2026 is the measurement date. Collection windows and report editions remain separate. The Qualtrics edition was released in 2025; Cisco surveyed in September 2025; Salesforce’s preference baseline was collected in 2024. The U.S. Chamber/Teneo adoption wave ran in July–August 2026. Consumer surveys, organizational reports, automated homepage scans and network telemetry should not be combined into a single population estimate.
No statistical association is presented as proof that a tool causes growth. Survey intentions and stated preferences are not transaction records. Accessibility findings do not establish legal compliance, and privacy research is not legal advice. The editorial plan is to review new releases, reporting windows, source links and product availability monthly before updating this reference.
Glossary
- AI: Artificial intelligence. Adoption definitions depend on the survey.
- API: Application programming interface, a route through which software systems exchange requests.
- Bot: Software that automates requests or tasks; automation can be useful or harmful.
- CRM: Customer relationship management, used to organize customer information and interactions.
- CX: Customer experience, including interactions beyond a website.
- HTML: The document format used for web pages; HTML-request shares exclude other content types in the cited analysis.
- SMB: Small or medium business. The cited surveys use different employee cutoffs.
- WCAG: Web Content Accessibility Guidelines. Automated checks cover only part of what accessibility evaluation requires.
Sources
- Sogolytics: Customer Experience Index Q2 2026. Citation date: October 2026. Data: June 2026; Q2 study wave. Sample: 1,001 U.S. customers; quotas for age, gender and geography; meaningful customer experience in preceding year.
- Qualtrics: 2026 Consumer Experience Trends: original research findings. Citation date: October 2025. Data: 2026 report edition, released October 7, 2025; edition is not collection year. Sample: 20,000 consumers across 14 countries.
- BrightLocal: Local Consumer Review Survey 2026. Citation date: February 2026. Data: 2026 survey edition; fieldwork dates not specified on public methodology. Sample: Representative panel of 1,002 U.S. adults via SurveyMonkey.
- Clutch: How Online Customer Reviews Are Shaping E-Commerce Buying Decisions in 2026. Citation date: February 2026. Data: 2026 report; page updated February 17, 2026. Sample: 400 U.S. consumers, described by original research release.
- Cisco: 2026 Data and Privacy Benchmark Study. Citation date: January 2026. Data: September 2025 survey; report released January 26, 2026. Sample: Over 5,200 IT, technology and security professionals with privacy responsibilities across 12 markets; independent analysis by Sandpiper Research & Insights.
- Imperva / Thales: 2026 Bad Bot Report: original findings. Citation date: April 2026. Data: Observed traffic in 2025; original research release April 29, 2026. Sample: Producer-observed traffic and attack telemetry; global network view.
- Cloudflare: 2025 Radar Year in Review. Citation date: December 2025. Data: January 1–December 2, 2025; release December 15, 2025. Sample: Cloudflare customer network observations.
- WebAIM: The WebAIM Million: 2026 analysis. Citation date: November 2026. Data: February 2026 analysis; access month used for undated live report. Sample: One million influential homepages, derived from Tranco ranking; WAVE automated analysis.
- World Health Organization: Disability fact sheet. Citation date: March 2023. Data: Fact sheet published March 7, 2023; estimate based on global disability research. Sample: Global population estimate of significant disability.
- U.S. Chamber of Commerce / Teneo Research: Empowering Small Business: The Impact of Technology on U.S. Small Business, Fifth Edition. Citation date: October 2026. Data: July 23–August 6, 2026; released October 2, 2026. Sample: 3,732 U.S. small businesses with fewer than 250 employees; online national survey by Teneo Research with C_TEC.
- Salesforce: Small & Medium Business Trends, Sixth Edition. Citation date: December 2024. Data: August 3–September 16, 2024; sixth edition released December 2024. Sample: 3,350 leaders from businesses with 200 or fewer employees across 26 countries.